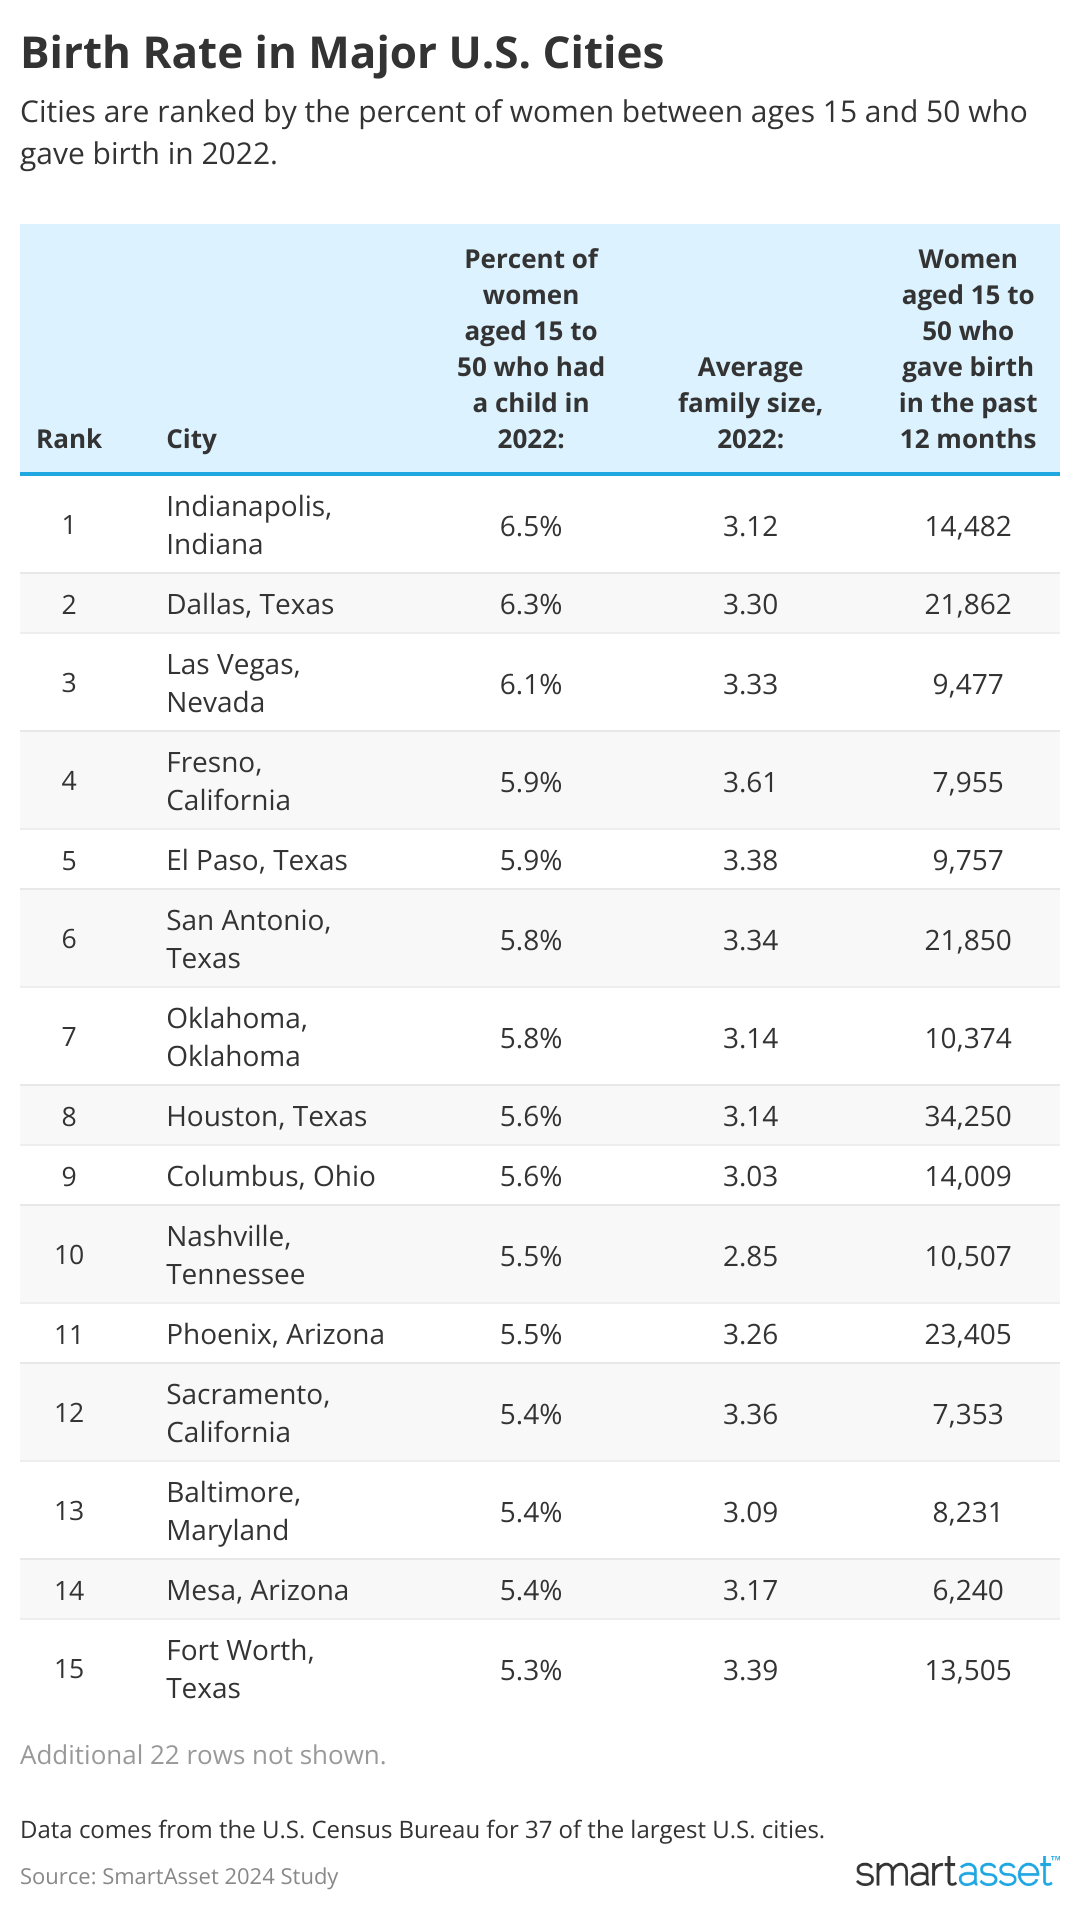
Zoteva // Shutterstock Jobs and other incentives have driven people in and out of cities for decades. But local economies can also be affected by birth rates and the size of families. From medical facilities and schools, to other institutions and businesses, birth rates and family size can influence both job and housing markets. With this in mind, SmartAsset examined U.S. Census data for 37 of the largest U.S. cities to determine where birth rates and family sizes are highest and lowest. Key Findings The birth rate in major U.S. cities is lower than the national average. Across all locations, the average rate of women aged 15 to 50 having a child in 2022 is 5.2%, compared to 5.0% in major cities. However, the average family size across the U.S. is 3.11, compared to 3.15 in major cities. Of all major U.S. cities, Indianapolis has the highest birth rate. Just over 6.5% of women between the ages of 15 and 50 gave birth, making Indianapolis the city where people are having children at the highest rate. This is an increase from the year before, when 5.8% of women between 15 and 50 had a child. Meanwhile, the average family size dropped from 3.24 in 2021 to 3.12 in 2022. Texas cities dominate the top 10 for highest birth rates. Four Texas cities rank for highest birth rates, including Dallas in second at 6.3%; El Paso (fifth, 5.9%); San Antonio (sixth, 5.8%); and Houston (eighth, 5.6%). Fort Worth, El Paso and San Antonio also rank among the top 10 for largest family size with averages of 3.39, 3.38 and 3.34 respectively. Families are largest in this city. On average, families in Fresno, CA consist of 3.61 people, which is above the 3.14 median across major cities. The birth rate here is fourth-highest studywide at 5.9%, after coming down from 6.5% just a year before. The average Seattle family is small. Seattle has both the lowest birth rate at 2.6%, as well as the smallest family size at 2.78 people per family. Milwaukee (3.2%) and Boston (3.4%) have the second- and third-lowest birth rates. Despite a small family size, the birth rate cracks the top 10 in this city. Nashville has the second-smallest average family size out of major U.S. cities at 2.85 people. Despite this, the city ranked with the 10th-highest birth rate at 5.5%. 10 Major U.S. Cities With the Highest Birth Rates SmartAsset Cities are ranked by the percent of women aged 15 to 50 who birthed a child in 2022 according to the U.S. Census Bureau. Indianapolis, IN Average family size, 2022: 3.12 Number of women aged 15 to 50 in 2022: 222,497 Number of women aged 15 to 50 years who had a birth in 2022: 14,482 Percent of women aged 15-50 who had a child in 2022: 6.5% Average family size, 2021: 3.24 Number of women aged 15 to 50 in 2021: 223,981 Number of women aged 15 to 50 years who had a birth in 2021: 12,950 Percent of women aged 15-50 who had a child in 2021: 5.8% Dallas, TX Average family size, 2022: 3.30 Number of women aged 15 to 50 in 2022: 348,616 Number of women aged 15 to 50 years who had a birth in 2022: 21,862 Percent of women aged 15-50 who had a child in 2022: 6.3% Average family size, 2021: 3.30 Number of women aged 15 to 50 in 2021: 334,151 Number of women aged 15 to 50 years who had a birth in 2021: 20,503 Percent of women aged 15-50 who had a child in 2021: 6.1% Las Vegas, NV Average family size, 2022: 3.33 Number of women aged 15 to 50 in 2022: 154,144 Number of women aged 15 to 50 years who had a birth in 2022: 9,477 Percent of women aged 15-50 who had a child in 2022: 6.1% Average family size, 2021: 3.26 Number of women aged 15 to 50 in 2021: 150,398 Number of women aged 15 to 50 years who had a birth in 2021: 6,570 Percent of women aged 15-50 who had a child in 2021: 4.4% Fresno, CA Average family size, 2022: 3.61 Number of women aged 15 to 50 in 2022: 134,334 Number of women aged 15 to 50 years who had a birth in 2022: 7,955 Percent of women aged 15-50 who had a child in 2022: 5.9% Average family size, 2021: 3.65 Number of women aged 15 to 50 in 2021: 137,326 Number of women aged 15 to 50 years who had a birth in 2021: 8,860 Percent of women aged 15-50 who had a child in 2021: 6.5% El Paso, TX Average family size, 2022: 3.38 Number of women aged 15 to 50 in 2022: 165,451 Number of women aged 15 to 50 years who had a birth in 2022: 9,757 Percent of women aged 15-50 who had a child in 2022: 5.9% Average family size, 2021: 3.32 Number of women aged 15 to 50 in 2021: 166,749 Number of women aged 15 to 50 years who had a birth in 2021: 11,296 Percent of women aged 15-50 who had a child in 2021: 6.8% San Antonio, TX Average family size, 2022: 3.34 Number of women aged 15 to 50 in 2022: 375,866 Number of women aged 15 to 50 years who had a birth in 2022: 21,850 Percent of women aged 15-50 who had a child in 2022: 5.8% Average family size, 2021: 3.25 Number of women aged 15 to 50 in 2021: 376,676 Number of women aged 15 to 50 years who had a birth in 2021: 21,617 Percent of women aged 15-50 who had a child in 2021: 5.7% Oklahoma City, OK Average family size, 2022: 3.14 Number of women aged 15 to 50 in 2022: 179,663 Number of women aged 15 to 50 years who had a birth in 2022: 10,374 Percent of women aged 15-50 who had a child in 2022: 5.8% Average family size, 2021: 3.12 Number of women aged 15 to 50 in 2021: 171,752 Number of women aged 15 to 50 years who had a birth in 2021: 8,379 Percent of women aged 15-50 who had a child in 2021: 4.9% Houston, TX Average family size, 2022: 3.14 Number of women aged 15 to 50 in 2022: 610,618 Number of women aged 15 to 50 years who had a birth in 2022: 34,250 Percent of women aged 15-50 who had a child in 2022: 5.6% Average family size, 2021: 3.16 Number of women aged 15 to 50 in 2021: 612,704 Number of women aged 15 to 50 years who had a birth in 2021: 36,192 Percent of women aged 15-50 who had a child in 2021: 5.9% Columbus, OH Average family size, 2022: 3.03 Number of women aged 15 to 50 in 2022: 250,708 Number of women aged 15 to 50 years who had a birth in 2022: 14,009 Percent of women aged 15-50 who had a child in 2022: 5.6% Average family size, 2021: 3.00 Number of women aged 15 to 50 in 2021: 249,550 Number of women aged 15 to 50 years who had a birth in 2021: 14,458 Percent of women aged 15-50 who had a child in 2021: 5.8% Nashville, TN Average family size, 2022: 2.85 Number of women aged 15 to 50 in 2022: 189,377 Number of women aged 15 to 50 years who had a birth in 2022: 10,507 Percent of women aged 15-50 who had a child in 2022: 5.5% Average family size, 2021: 2.84 Number of women aged 15 to 50 in 2021: 189,037 Number of women aged 15 to 50 years who had a birth in 2021: 10,500 Percent of women aged 15-50 who had a child in 2021: 5.6% 10 Major U.S. Cities With the Lowest Birth Rates Cities are ranked by the percent of women aged 15 to 50 who birthed a child in 2022 according to the U.S. Census Bureau. Seattle, WA Average family size, 2022: 2.78 Number of women aged 15 to 50 in 2022: 219,609 Number of women aged 15 to 50 years who had a birth in 2022: 5,760 Percent of women aged 15-50 who had a child in 2022: 2.6% Average family size, 2021: 2.75 Number of women aged 15 to 50 in 2021: 218,807 Number of women aged 15 to 50 years who had a birth in 2021: 7,485 Percent of women aged 15-50 who had a child in 2021: 3.4% Milwaukee, WI Average family size, 2022: 3.36 Number of women aged 15 to 50 in 2022: 152,311 Number of women aged 15 to 50 years who had a birth in 2022: 4,848 Percent of women aged 15-50 who had a child in 2022: 3.2% Average family size, 2021: 3.18 Number of women aged 15 to 50 in 2021: 155,828 Number of women aged 15 to 50 years who had a birth in 2021: 7,648 Percent of women aged 15-50 who had a child in 2021: 4.9% Boston, MA Average family size, 2022: 2.90 Number of women aged 15 to 50 in 2022: 199,435 Number of women aged 15 to 50 years who had a birth in 2022: 6,760 Percent of women aged 15-50 who had a child in 2022: 3.4% Average family size, 2021: 3.09 Number of women aged 15 to 50 in 2021: 199,696 Number of women aged 15 to 50 years who had a birth in 2021: 6,974 Percent of women aged 15-50 who had a child in 2021: 3.5% Portland, OR Average family size, 2022: 2.92 Number of women aged 15 to 50 in 2022: 176,930 Number of women aged 15 to 50 years who had a birth in 2022: 6,239 Percent of women aged 15-50 who had a child in 2022: 3.5% Average family size, 2021: 2.91 Number of women aged 15 to 50 in 2021: 181,433 Number of women aged 15 to 50 years who had a birth in 2021: 4,908 Percent of women aged 15-50 who had a child in 2021: 2.7% Austin, TX Average family size, 2022: 2.88 Number of women aged 15 to 50 in 2022: 285,094 Number of women aged 15 to 50 years who had a birth in 2022: 10,736 Percent of women aged 15-50 who had a child in 2022: 3.8% Average family size, 2021: 2.94 Number of women aged 15 to 50 in 2021: 281,594 Number of women aged 15 to 50 years who had a birth in 2021: 12,540 Percent of women aged 15-50 who had a child in 2021: 4.5% San Diego, CA Average family size, 2022: 3.15 Number of women aged 15 to 50 in 2022: 362,133 Number of women aged 15 to 50 years who had a birth in 2022: 14,666 Percent of women aged 15-50 who had a child in 2022: 4.0% Average family size, 2021: 3.27 Number of women aged 15 to 50 in 2021: 358,444 Number of women aged 15 to 50 years who had a birth in 2021: 15,293 Percent of women aged 15-50 who had a child in 2021: 4.3% Washington, DC Average family size, 2022: 3.02 Number of women aged 15 to 50 in 2022: 202,248 Number of women aged 15 to 50 years who had a birth in 2022: 8,309 Percent of women aged 15-50 who had a child in 2022: 4.1% Average family size, 2021: 3.03 Number of women aged 15 to 50 in 2021: 200,232 Number of women aged 15 to 50 years who had a birth in 2021: 7,874 Percent of women aged 15-50 who had a child in 2021: 3.9% Denver, CO Average family size, 2022: 2.96 Number of women aged 15 to 50 in 2022: 203,692 Number of women aged 15 to 50 years who had a birth in 2022: 8,490 Percent of women aged 15-50 who had a child in 2022: 4.2% Average family size, 2021: 2.98 Number of women aged 15 to 50 in 2021: 203,324 Number of women aged 15 to 50 years who had a birth in 2021: 7,708 Percent of women aged 15-50 who had a child in 2021: 3.8% Los Angeles, CA Average family size, 2022: 3.35 Number of women aged 15 to 50 in 2022: 989,408 Number of women aged 15 to 50 years who had a birth in 2022: 41,703 Percent of women aged 15-50 who had a child in 2022: 4.2% Average family size, 2021: 3.44 Number of women aged 15 to 50 in 2021: 1,003,660 Number of women aged 15 to 50 years who had a birth in 2021: 42,460 Percent of women aged 15-50 who had a child in 2021: 4.2% Chicago, IL Average family size, 2022: 3.17 Number of women aged 15 to 50 in 2022: 727,723 Number of women aged 15 to 50 years who had a birth in 2022: 30,946 Percent of women aged 15-50 who had a child in 2022: 4.3% Average family size, 2021: 3.26 Number of women aged 15 to 50 in 2021: 730,136 Number of women aged 15 to 50 years who had a birth in 2021: 33,023 Percent of women aged 15-50 who had a child in 2021: 4.5% Data and Methodology To determine the birth rate, SmartAsset reviewed the most recently available Census Bureau data for 2022 and 2021. For 37 of the largest U.S. cities for which data was available, the number of women aged 15 to 50 who had a baby in the past 12 months was compared against the total number of women aged 15 to 50. Average family size was also considered. This story was produced by SmartAsset and reviewed and distributed by Stacker Media.
Which U.S. cities have the highest and lowest birth rates?