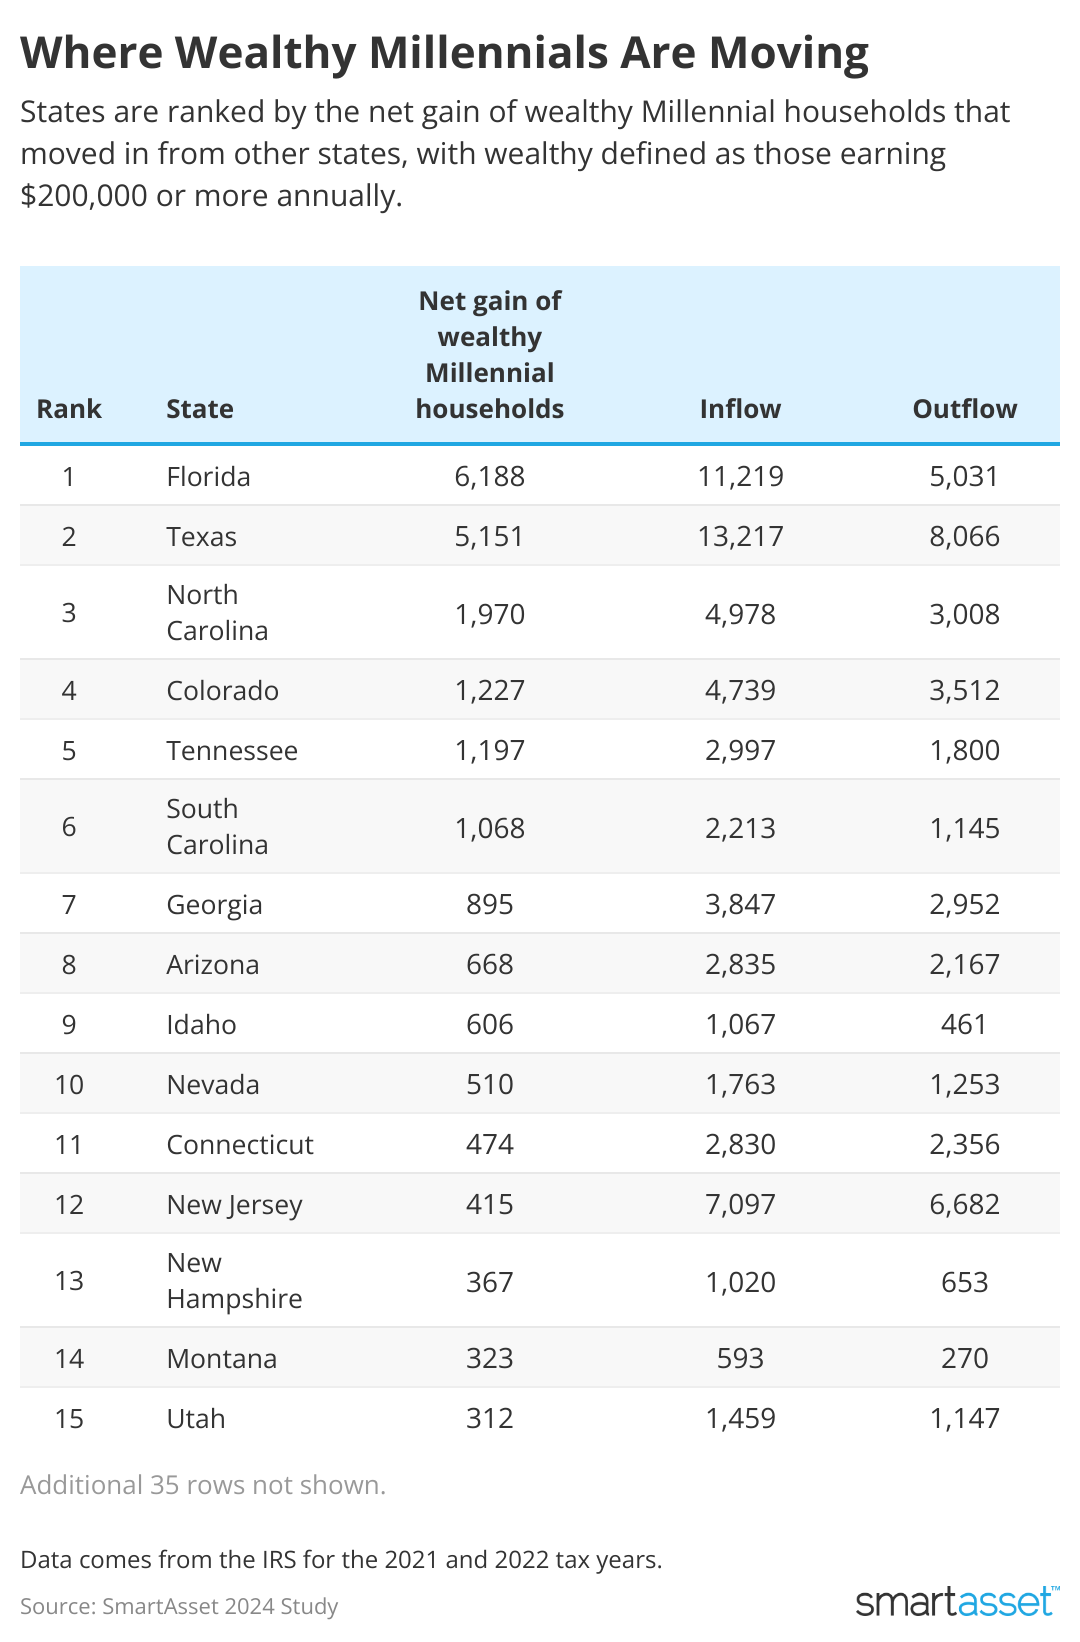
Artiom Photo // Shutterstock According to the Census Bureau, the median income in the U.S. is around $75,000, with millennials earning higher than average at roughly $84,000 annually. But many millennials eclipse the median, with some households bringing in more than $200,000 per year–earning the classification of “high earners,” per the IRS. These millennials in particular have more disposable income and economic freedom than their median counterparts, so their impact on local economies can be outsized. When these wealthy millennials choose to move for job opportunities, lifestyle, family and other reasons, their disproportionate economic power also goes with them. With this in mind, SmartAsset examined the latest tax return data to determine which states these wealthy millennials are moving to and from. Key Findings Florida and Texas gained the most wealthy millennial households. When looking at the inflow and outflow of wealthy millennials, Florida had the highest net immigration of high earners in this age group with 6,188 households. Texas ranked second with a net gain of 5,151 households. Trailing behind in third was North Carolina with a net of 1,970 households moved in. Wealthy millennials have a preference for Colorado and Georgia compared to peers in other generations. In both states, the number of high-earning millennial households make up 87% of the net gain of all high-earning households that moved to each. Colorado gained 1,227 wealthy millennial households, out of a total net gain of 1,403 households earning $200,000 or more per year. For Georgia, 895 of the 1,024 wealthy households that moved in were millennials. Overall, Colorado ranked fourth and Georgia ranked seventh for where most wealthy millennials moved. Wealthy millennials leave California and New York. California lost a net of 9,181 wealthy millennial households, the most studywide. New York lost second-most at 4,251 net households. Illinois (-3,163) and Massachusetts (-1,927) also lost a significant amount of wealthy millennials. Utah has the highest percentage of wealthy households that are millennials. Out of a total of 94,488 households making over $200,000 per year, 25% are millennials in Utah. Overall, Utah ranks 15th for where high-earning millennials moved. Washington state has the second-highest rate of millennials among high-earners at 24.6%. Meanwhile, New Mexico has the lowest occurrence of wealthy millennials at just 15% of all households earning $200k+. Wealthy millennials in these states earn the most, on average. When adjusting the total AGI for this age group across the number of returns in each state, Wyoming, Nevada and Arkansas come out on top. On average, the AGI for wealthy millennials in Wyoming is $755,000, compared to $705,000 in Nevada and $679,000 in Arkansas. Top 10 States Wealthy Millennials Are Moving To SmartAsset Florida Net gain of wealthy millennial households: 6,188 Wealthy millennial inflow: 11,219 Wealthy millennial outflow: 5,031 Total number of millennial returns with income $200k+: 137,049 Average AGI for wealthy millennial households: $551,114 Percent of wealthy households that are millennials: 15.6% Texas Net gain of wealthy millennial households: 5,151 Wealthy millennial inflow: 13,217 Wealthy millennial outflow: 8,066 Total number of millennial returns with income $200k+: 261,892 Average AGI for wealthy millennial households: $469,975 Percent of wealthy households that are millennials: 22.7% North Carolina Net gain of wealthy millennial households: 1,970 Wealthy millennial inflow: 4,978 Wealthy millennial outflow: 3,008 Total number of millennial returns with income $200k+: 78,142 Average AGI for wealthy millennial households: $430,957 Percent of wealthy households that are millennials: 20.2% Colorado Net gain of wealthy millennial households: 1,227 Wealthy millennial inflow: 4,739 Wealthy millennial outflow: 3,512 Total number of millennial returns with income $200k+: 76,264 Average AGI for wealthy millennial households: $451,535 Percent of wealthy households that are millennials: 22.3% Tennessee Net gain of wealthy millennial households: 1,197 Wealthy millennial inflow: 2,997 Wealthy millennial outflow: 1,800 Total number of millennial returns with income $200k+: 43,778 Average AGI for wealthy millennial households: $505,905 Percent of wealthy households that are millennials: 19.5% South Carolina Net gain of wealthy millennial households: 1,068 Wealthy millennial inflow: 2,213 Wealthy millennial outflow: 1,145 Total number of millennial returns with income $200k+: 27,501 Average AGI for wealthy millennial households: $431,694 Percent of wealthy households that are millennials: 17.2% Georgia Net gain of wealthy millennial households: 895 Wealthy millennial inflow: 3,847 Wealthy millennial outflow: 2,952 Total number of millennial returns with income $200k+: 78,314 Average AGI for wealthy millennial households: $446,434 Percent of wealthy households that are millennials: 20.4% Arizona Net gain of wealthy millennial households: 668 Wealthy millennial inflow: 2,835 Wealthy millennial outflow: 2,167 Total number of millennial returns with income $200k+: 47,404 Average AGI for wealthy millennial households: $471,591 Percent of wealthy households that are millennials: 17.9% Idaho Net gain of wealthy millennial households: 606 Wealthy millennial inflow: 1,067 Wealthy millennial outflow: 461 Total number of millennial returns with income $200k+: 11,997 Average AGI for wealthy millennial households: $450,278 Percent of wealthy households that are millennials: 19.5% Nevada Net gain of wealthy millennial households: 510 Wealthy millennial inflow: 1,763 Wealthy millennial outflow: 1,253 Total number of millennial returns with income $200k+: 19,608 Average AGI for wealthy millennial households: $704,865 Percent of wealthy households that are millennials: 17.6% Top 10 States Wealthy millennials Are Moving Out Of California Net loss of wealthy millennial households: -9,181 Wealthy millennial inflow: 14,139 Wealthy millennial outflow: 23,320 Total number of millennial returns with income $200k+: 589,524 Average AGI for wealthy millennial households: $557,054 Percent of wealthy households that are millennials: 23.1% New York Net loss of wealthy millennial households: -4,251 Wealthy millennial inflow: 11,340 Wealthy millennial outflow: 15,591 Total number of millennial returns with income $200k+: 242,762 Average AGI for wealthy millennial households: $577,533 Percent of wealthy households that are millennials: 21.6% Illinois Net loss of wealthy millennial households: -3,163 Wealthy millennial inflow: 3,694 Wealthy millennial outflow: 6,857 Total number of millennial returns with income $200k+: 127,494 Average AGI for wealthy millennial households: $470,112 Percent of wealthy households that are millennials: 21.5% Massachusetts Net loss of wealthy millennial households: -1,927 Wealthy millennial inflow: 3,683 Wealthy millennial outflow: 5,610 Total number of millennial returns with income $200k+: 112,546 Average AGI for wealthy millennial households: $479,226 Percent of wealthy households that are millennials: 21.3% Pennsylvania Net loss of wealthy millennial households: -609 Wealthy millennial inflow: 3,883 Wealthy millennial outflow: 4,492 Total number of millennial returns with income $200k+: 103,435 Average AGI for wealthy millennial households: $420,588 Percent of wealthy households that are millennials: 19.6% Minnesota Net loss of wealthy millennial households: -365 Wealthy millennial inflow: 1,399 Wealthy millennial outflow: 1,764 Total number of millennial returns with income $200k+: 58,174 Average AGI for wealthy millennial households: $397,778 Percent of wealthy households that are millennials: 22.6% Louisiana Net loss of wealthy millennial households: -325 Wealthy millennial inflow: 643 Wealthy millennial outflow: 968 Total number of millennial returns with income $200k+: 20,847 Average AGI for wealthy millennial households: $413,864 Percent of wealthy households that are millennials: 19.8% Washington Net loss of wealthy millennial households: -222 Wealthy millennial inflow: 6,605 Wealthy millennial outflow: 6,827 Total number of millennial returns with income $200k+: 144,475 Average AGI for wealthy millennial households: $459,701 Percent of wealthy households that are millennials: 24.6% Michigan Net loss of wealthy millennial households: -189 Wealthy millennial inflow: 1,986 Wealthy millennial outflow: 2,175 Total number of millennial returns with income $200k+: 60,457 Average AGI for wealthy millennial households: $418,757 Percent of wealthy households that are millennials: 18.1% Missouri Net loss of wealthy millennial households: -168 Wealthy millennial inflow: 1,341 Wealthy millennial outflow: 1,509 Total number of millennial returns with income $200k+: 35,841 Average AGI for wealthy millennial households: $435,553 Percent of wealthy households that are millennials: 19.9% Data and Methodology To determine where wealthy millennials are moving, SmartAsset examined the latest IRS data, which comes from the 2021 and 2022 tax years. Wealthy households are defined here as those with adjusted gross incomes of $200,000 or more, which the IRS deems as the threshold for “high earners.” Applicable tax returns filed for households aged 26 to 45 were considered. The inflow of qualifying households in each state were compared with the outflows to determine the net migration of high-earning households. The average AGI for a state’s wealthy millennials households was also considered. This story was produced by SmartAsset and reviewed and distributed by Stacker Media.
Where wealthy millennials are moving