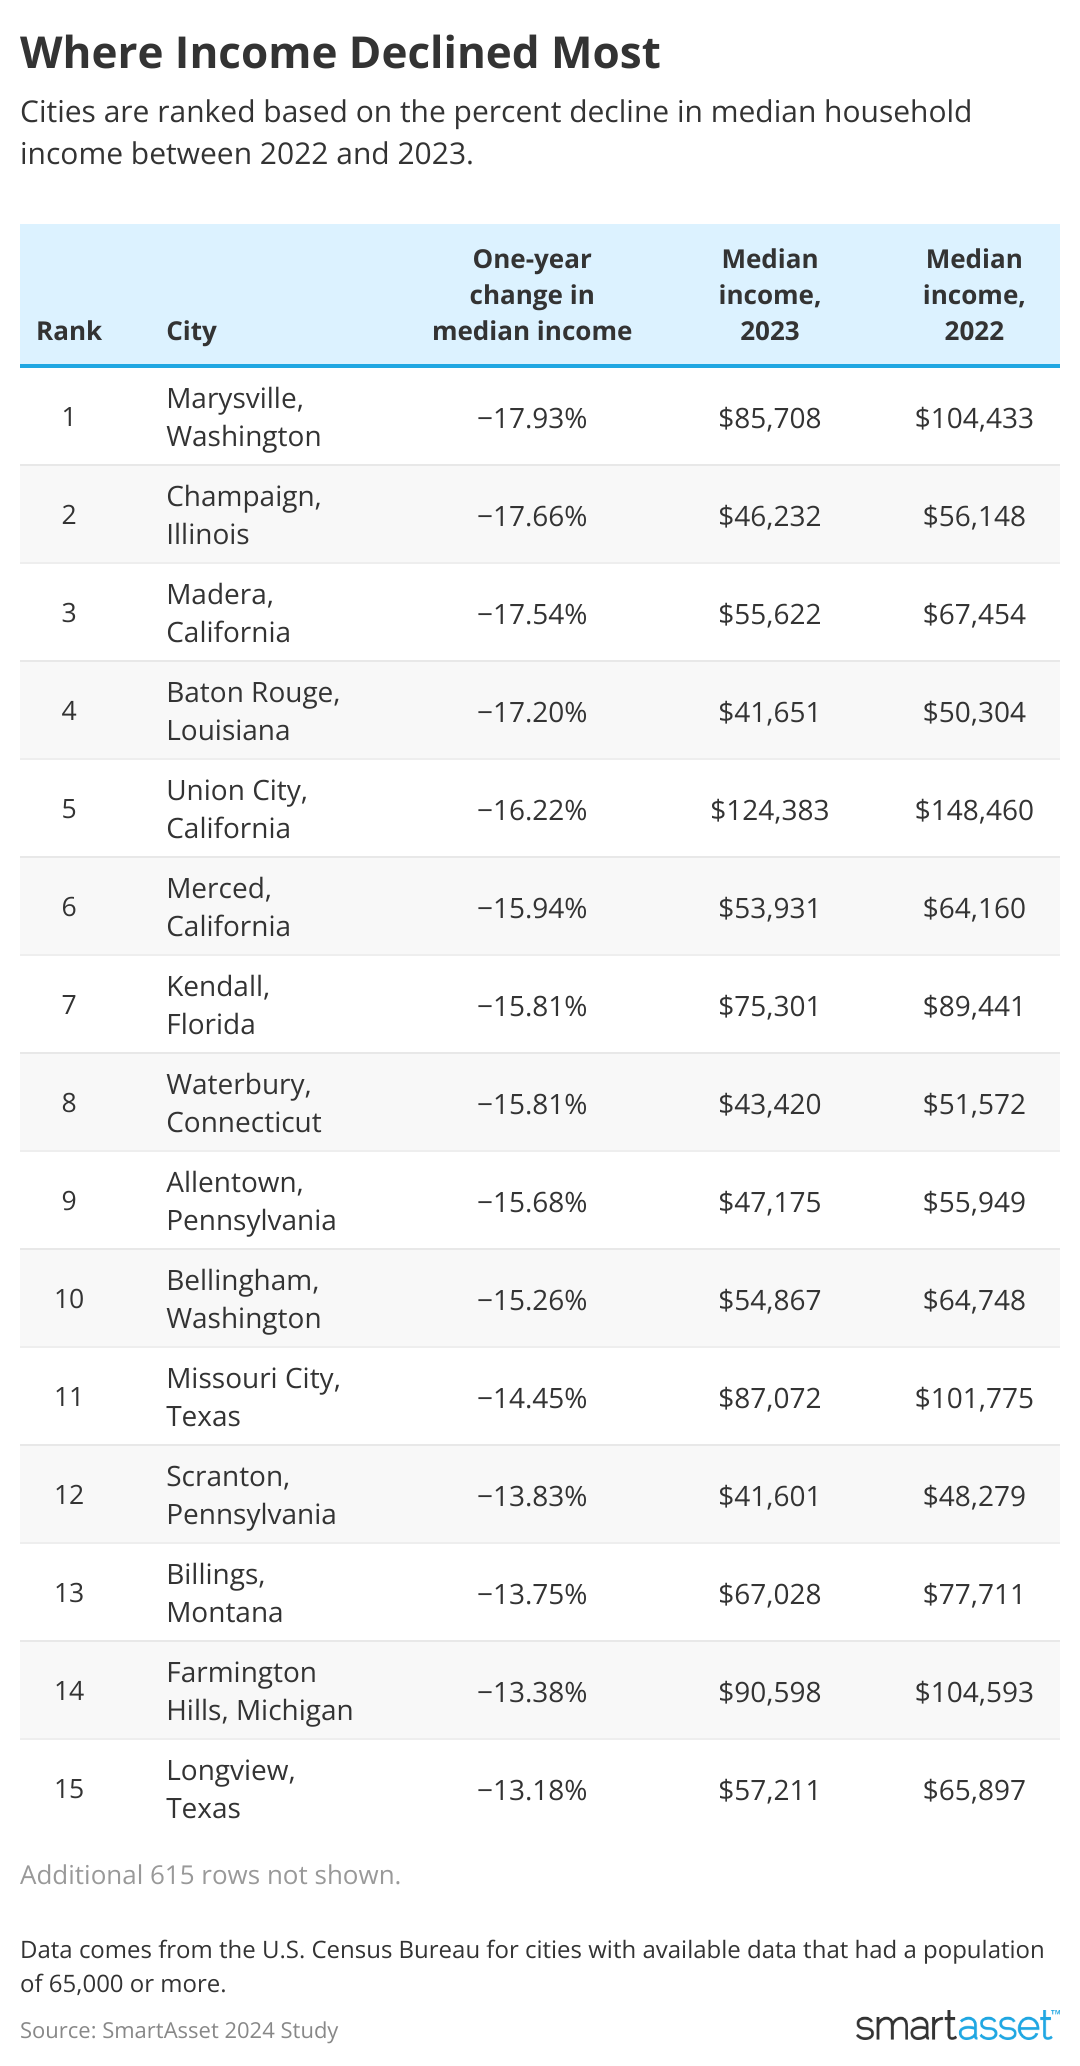
Cascade Creatives // Shutterstock Just as inflation can drive up costs, macroeconomic shifts, layoffs, or industry downturns can lead to declines in household income, potentially posing challenges to families affording housing, groceries, and other necessities. For some, a dollar doesn’t stretch as far when income drops faster than expenses increase. According to the latest Census Bureau data, household income changes can vary widely across cities, and while some cities see incomes outpace inflation, others may experience sharp declines that exacerbate rising costs. To better understand these trends, SmartAsset analyzed data from 630 cities to rank them based on the percentage decline in median household income over one year, according to the latest data from the Census Bureau. Key Findings This Seattle suburb saw the largest income decline nationwide. Marysville, WA saw the median household income drop from $104,433 in 2022 to $85,708 in 2023–a 17.93% decrease over just one year. The portion of households earning $100,000 or more dropped from 54.0% to 40.6% during the same time, although the portion of households earning over $200,000 increased slightly from 10.0% to 13.1%. Wealth inequality increased in these cities. In addition to Marysville, several other cities saw a drop in median household income as well as the portion earning over $100,000, while the percentage of households earning over $200,000 increased – leading to a larger disparity between earning groups. These cities include Pflugerville, TX; Palm Bay, FL; Melbourne, FL; Atascocita, TX; Georgetown, TX; Malden, MA; Lodi, CA; Missouri City, TX; Rialto, CA; Lorain, OH; and Deerfield Beach, FL, among others. 33 cities saw incomes decline by 10% or more over one year. Significant declines in income were most prevalent in California (8 cities), Washington (3 cities), Texas (3 cities) and Pennsylvania (3 cities). In Kendall, FL and Palmdale, CA, these significant declines dropped the local median household income below the U.S. median of $80,610. Seven cities had a median income below $40,000. Flint, MI had the lowest median income at $33,141. The six others include Gary, IN ($35,033); Camden, NJ ($38,080); Detroit, MI ($38,080); Reading, PA ($38,814); Cleveland, OH ($39,041); and Canton, OH ($39,692). Top 10 Places Where Income Declined the Most SmartAsset Cities are ranked according to the percent change in estimated median household income between 2023 and 2022. Marysville, Washington One-year change in median income: -17.93% Median income, 2023: $85,708 Median income, 2022: $104,433 Percent of households earning $100k or more, 2023: 40.6% Percent of households earning $100k or more, 2022: 54.0% Percent of households earning $200k or more, 2023: 13.1% Percent of households earning $200k or more, 2022: 10% Champaign, Illinois One-year change in median income: -17.66% Median income, 2023: $46,232 Median income, 2022: $56,148 Percent of households earning $100k or more, 2023: 22.5% Percent of households earning $100k or more, 2022: 27% Percent of households earning $200k or more, 2023: 7.5% Percent of households earning $200k or more, 2022: 7.6% Madera, California One-year change in median income: -17.54% Median income, 2023: $55,622 Median income, 2022: $67,454 Percent of households earning $100k or more, 2023: 23.6% Percent of households earning $100k or more, 2022: 30.1% Percent of households earning $200k or more, 2023: 4% Percent of households earning $200k or more, 2022: 3.8% Baton Rouge, Louisiana One-year change in median income: -17.20% Median income, 2023: $41,651 Median income, 2022: $50,304 Percent of households earning $100k or more, 2023: 21.8% Percent of households earning $100k or more, 2022: 22.2% Percent of households earning $200k or more, 2023: 6.4% Percent of households earning $200k or more, 2022: 6.4% Union City, California One-year change in median income: -16.22% Median income, 2023: $124,383 Median income, 2022: $148,460 Percent of households earning $100k or more, 2023: 58.3% Percent of households earning $100k or more, 2022: 62.3% Percent of households earning $200k or more, 2023: 29% Percent of households earning $200k or more, 2022: 34.5% Merced, California One-year change in median income: -15.94% Median income, 2023: $53,931 Median income, 2022: $64,160 Percent of households earning $100k or more, 2023: 26.2% Percent of households earning $100k or more, 2022: 28.8% Percent of households earning $200k or more, 2023: 5.7% Percent of households earning $200k or more, 2022: 3.8% Kendall, Florida One-year change in median income: -15.81% Median income, 2023: $75,301 Median income, 2022: $89,441 Percent of households earning $100k or more, 2023: 41.5% Percent of households earning $100k or more, 2022: 44.5% Percent of households earning $200k or more, 2023: 17.4% Percent of households earning $200k or more, 2022: 18.2% Waterbury, Connecticut One-year change in median income: -15.81% Median income, 2023: $43,420 Median income, 2022: $51,572 Percent of households earning $100k or more, 2023: 16.6% Percent of households earning $100k or more, 2022: 23.7% Percent of households earning $200k or more, 2023: 1.4% Percent of households earning $200k or more, 2022: 3.8% Allentown, Pennsylvania One-year change in median income: -15.68% Median income, 2023: $47,175 Median income, 2022: $55,949 Percent of households earning $100k or more, 2023: 17.8% Percent of households earning $100k or more, 2022: 19.1% Percent of households earning $200k or more, 2023: 4% Percent of households earning $200k or more, 2022: 2.9% Bellingham, Washington One-year change in median income: -15.26% Median income, 2023: $54,867 Median income, 2022: $64,748 Percent of households earning $100k or more, 2023: 27.7% Percent of households earning $100k or more, 2022: 29.1% Percent of households earning $200k or more, 2023: 8.2% Percent of households earning $200k or more, 2022: 7.6% Top 10 Places With the Lowest Median Income Cities are ranked according to the lowest estimated median household income in 2023. Flint, Michigan Median income, 2023: $33,141 Median income, 2022: $33,036 One-year change in median income: 0.3% Percent of households earning $100k or more, 2023: 9.6% Percent of households earning $100k or more, 2022: 7.9% Percent of households earning $200k or more, 2023: 1.2% Percent of households earning $200k or more, 2022: 0.8% Gary, Indiana Median income, 2023: $35,033 Median income, 2022: $36,153 One-year change in median income: -3.1% Percent of households earning $100k or more, 2023: 13.2% Percent of households earning $100k or more, 2022: 14.7% Percent of households earning $200k or more, 2023: 3.7% Percent of households earning $200k or more, 2022: 2.2% Camden, New Jersey Median income, 2023: $35,129 Median income, 2022: $37,075 One-year change in median income: -5.2% Percent of households earning $100k or more, 2023: 14.3% Percent of households earning $100k or more, 2022: 14.3% Percent of households earning $200k or more, 2023: 0.6% Percent of households earning $200k or more, 2022: 1.6% Detroit, Michigan Median income, 2023: $38,080 Median income, 2022: $36,453 One-year change in median income: 4.5% Percent of households earning $100k or more, 2023: 15% Percent of households earning $100k or more, 2022: 12.7% Percent of households earning $200k or more, 2023: 2.7% Percent of households earning $200k or more, 2022: 2.2% Reading, Pennsylvania Median income, 2023: $38,814 Median income, 2022: $43,496 One-year change in median income: -10.8% Percent of households earning $100k or more, 2023: 13.2% Percent of households earning $100k or more, 2022: 12.3% Percent of households earning $200k or more, 2023: 3% Percent of households earning $200k or more, 2022: 1.6% Cleveland, Ohio Median income, 2023: $39,041 Median income, 2022: $37,351 One-year change in median income: 4.5% Percent of households earning $100k or more, 2023: 15.7% Percent of households earning $100k or more, 2022: 14% Percent of households earning $200k or more, 2023: 3.1% Percent of households earning $200k or more, 2022: 3.1% Canton, Ohio Median income, 2023: $39,692 Median income, 2022: $40,711 One-year change in median income: -2.5% Percent of households earning $100k or more, 2023: 8.9% Percent of households earning $100k or more, 2022: 9.8% Percent of households earning $200k or more, 2023: 1.3% Percent of households earning $200k or more, 2022: 2.1% Erie, Pennsylvania Median income, 2023: $41,377 Median income, 2022: $43,839 One-year change in median income: -5.6% Percent of households earning $100k or more, 2023: 15.3% Percent of households earning $100k or more, 2022: 13.5% Percent of households earning $200k or more, 2023: 2.1% Percent of households earning $200k or more, 2022: 3.7% Lorain, Ohio Median income, 2023: $41,480 Median income, 2022: $46,592 One-year change in median income: -11.0% Percent of households earning $100k or more, 2023: 18.1% Percent of households earning $100k or more, 2022: 19.3% Percent of households earning $200k or more, 2023: 4% Percent of households earning $200k or more, 2022: 1.8% Scranton, Pennsylvania Median income, 2023: $41,601 Median income, 2022: $48,279 One-year change in median income: -13.8% Percent of households earning $100k or more, 2023: 18.2% Percent of households earning $100k or more, 2022: 20.5% Percent of households earning $200k or more, 2023: 2.7% Percent of households earning $200k or more, 2022: 3.6% Data and Methodology SmartAsset examined data for estimated local median household incomes from the Census Bureau for 2023 and 2022 for 630 cities with available data and a population of at least 65,000. The percentage of households earning at least $100,000 and at least $200,000 each year was also examined. This story was produced by SmartAsset and reviewed and distributed by Stacker.
Where income has declined most nationwide